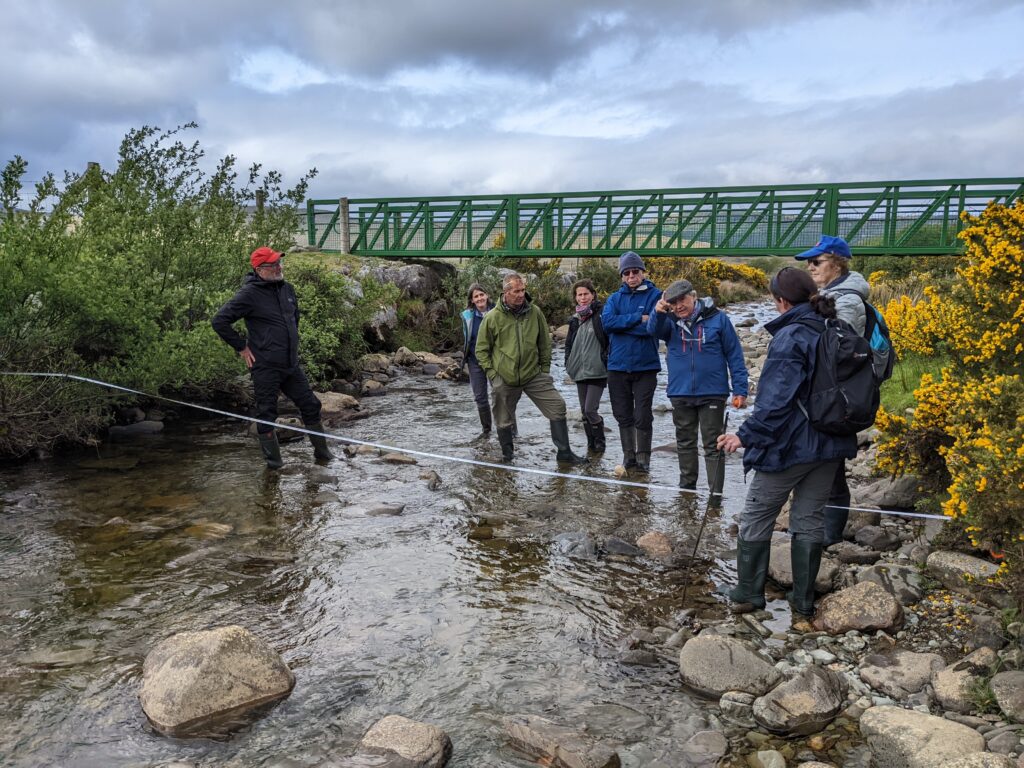
On Sunday 8 May 2022 we visited the Carrowniskey river again – this time concentrating on physical aspects such as flooding. Beginning at the Glenkeen Estate we measured the flow in the river using a high-tech combination of measuring tape, meter stick, an orange + stop watch. Check out the side bar box for the method.
We then looked at the official flow gauge at the bridge at Cregganbaun. On the outside there is a ‘staff gauge’ marked off in black and white one-centimetre bands next to a long hollow tube attached to the bridge. Tiernan Henry our guest hydrologist from NUIG explained how these gauges work: with a pressure gauge about the size of a mobile phone at the bottom of a long tube or ‘stilling chamber’ that measures the depth of water continuously.
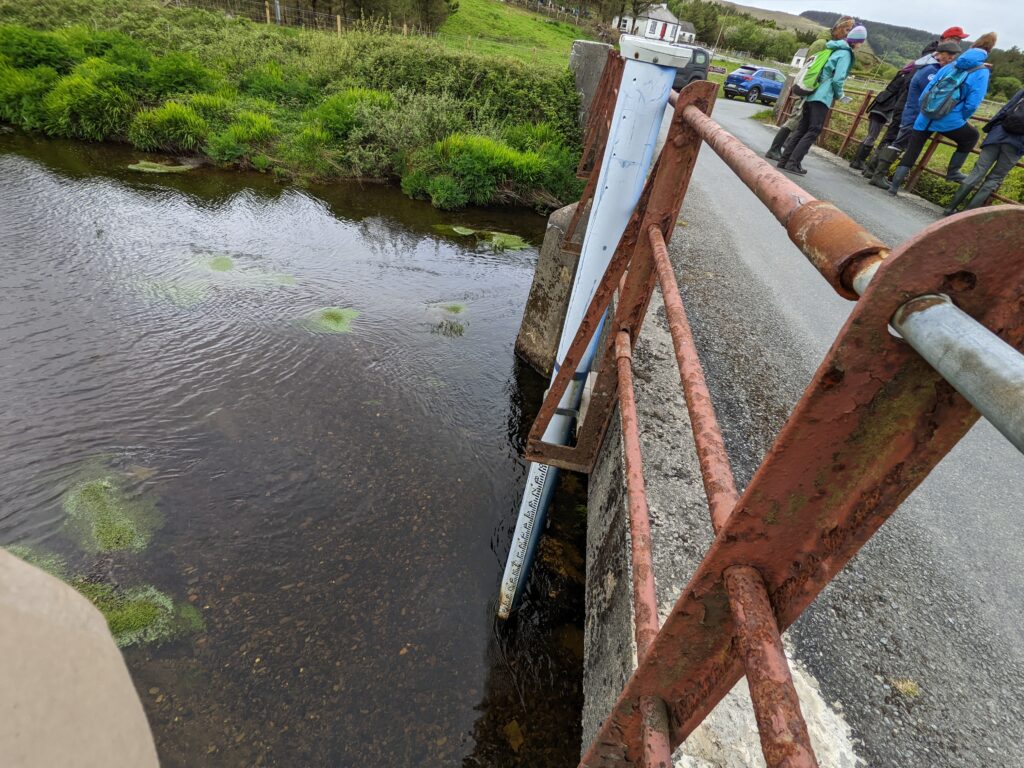
The depth values are continually sent to the website waterlevel.ie. The depths are calibrated to make what is called a ‘rating curve’ that allows water depth in the tube to be converted to flow measured in tonnes of water per second passing downstream – metres cubed per second or cumecs. Typically, the rating curve is a curved line relating water height to flow rate so that if you know the water level you can tell how many tonnes or litres of water pass by every second.
How We Measured the Flow in the River
We measured the cross-sectional area of water by checking the depth every 50 cm and adding up each 50 by x cm depth. The other part of the equation is the average water velocity in terms of metres per second. This is where the orange comes in. Oranges float just below the surface and give a good indication of surface water flow velocity. With a stop watch running on a mobile phone we check how long the orange takes to travel 5 metres. We repeated this a few times and took the average time. Multiplying the area by the velocity we got a flow of approximately 200 litres per second on the day.
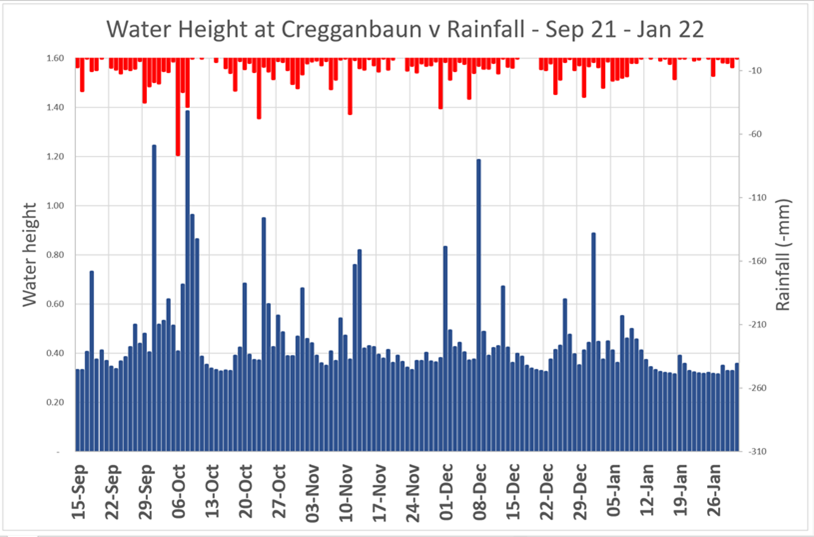
Some recent data for the gauge at Cregganbaun showed peak water heights of just over 2 m which is getting quite close to the top of the bridge. On flooding days, it would be even higher than this. Flow is of course driven by rainfall and a graph of rainfall in the Delphi rain gauge compared very well with the water height at Cregganbaun with about a day’s delay between daily rainfall and peak flow.
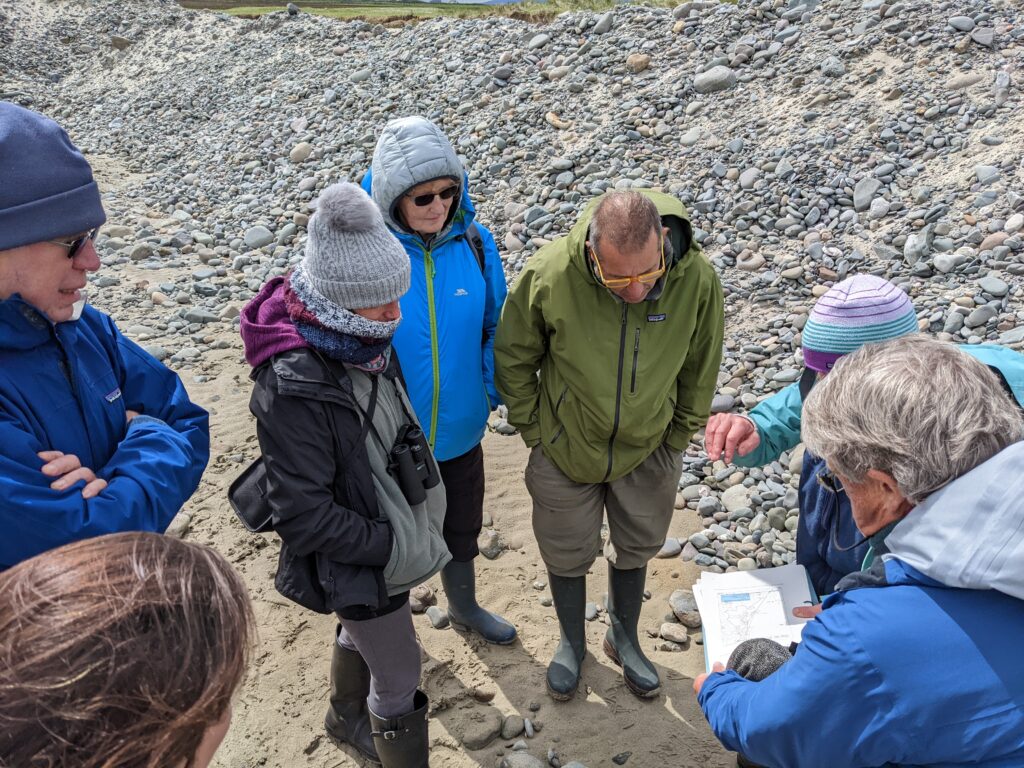
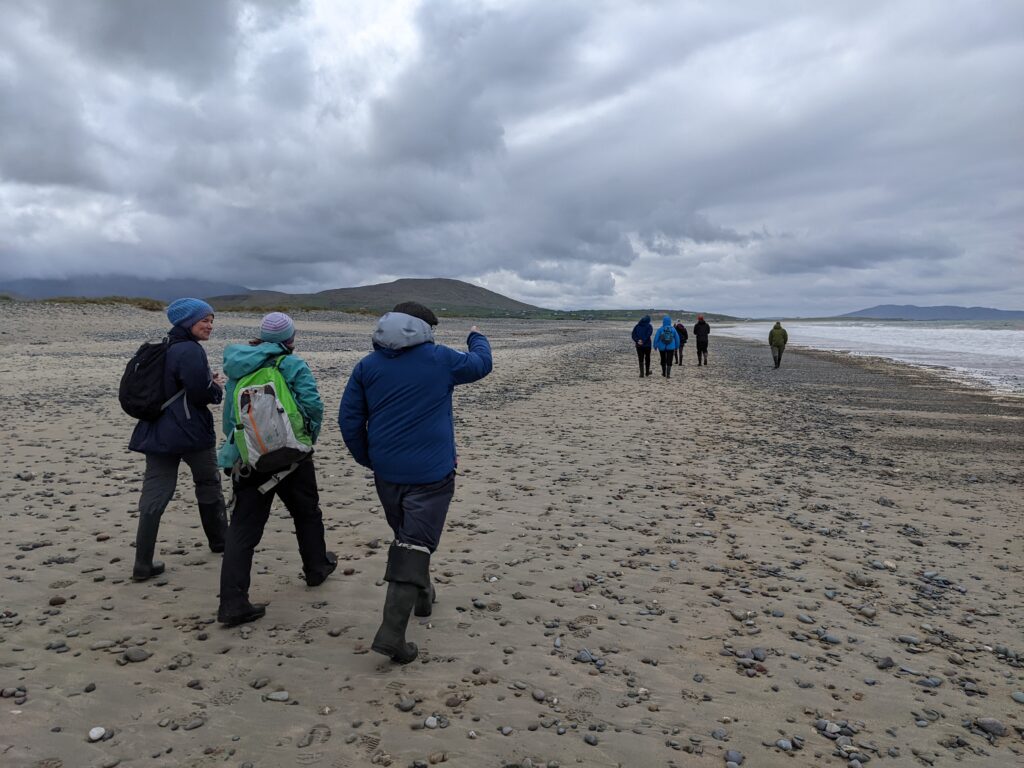
Catherine Farrell from the new LIFE on Machair project then brought us to the outflow of the Carrowniskey River where it flows into Roonagh Lough and finally across the shingle of Carrowniskey Beach. Care is needed walking on the shingle as ground nesting birds such as ringed plover lay their eggs here. They are extremely vulnerable to disturbance and predators. Set above the beach is the Machair which is still a place for breeding waders such as Dunlin and indeed it is one of the very few remaining breeding sites for Dunlin in Ireland. Again, these birds are extremely vulnerable to disturbance and predators. We also saw displaying lapwings, terns, sanderlings, and above us all the time larks singing in the clear air.
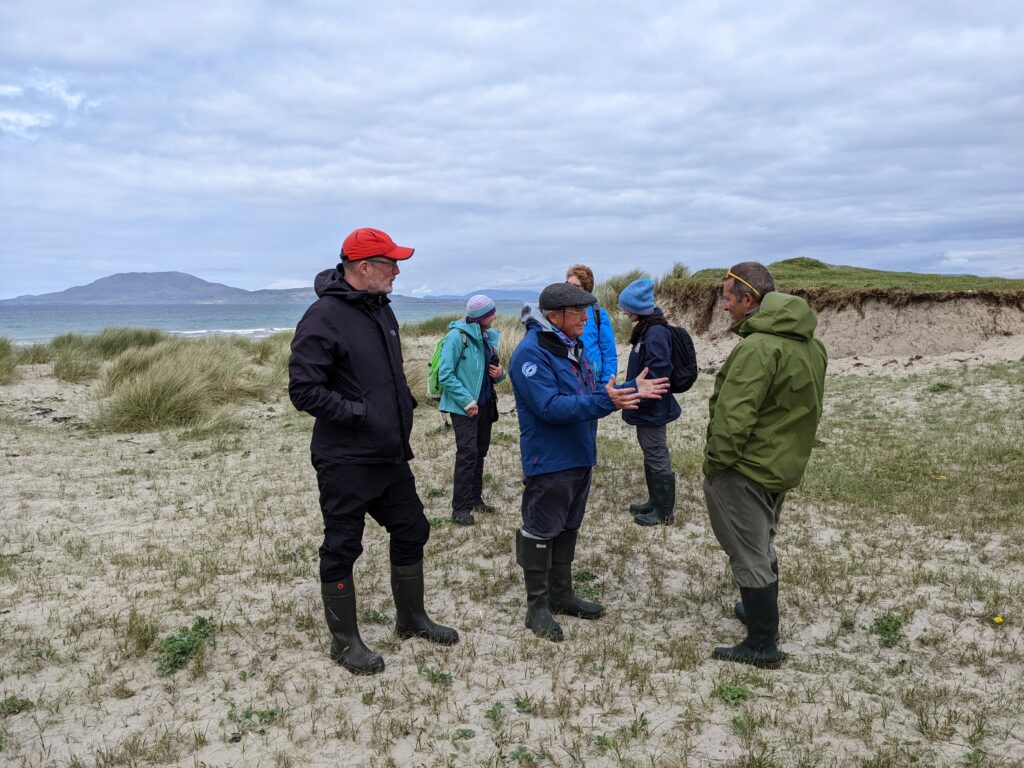
The LIFE on Machair project aims to increase awareness of how unique and sensitive these habitats are. Then with buy-in and cooperation from local land owners and farmers it aims to create a management programme that will protect the habitat and the birds and plants associated with the Machair, Roonagh Lough and the shingle nesting areas.
In the afternoon we repaired to Glenkeen Estate for lunch and some exploration of the various data sources available on the web. We talked about flow and rainfall data, flood maps Links to the many sources of water-related data are available on the “Useful Data Sources” page on this website.