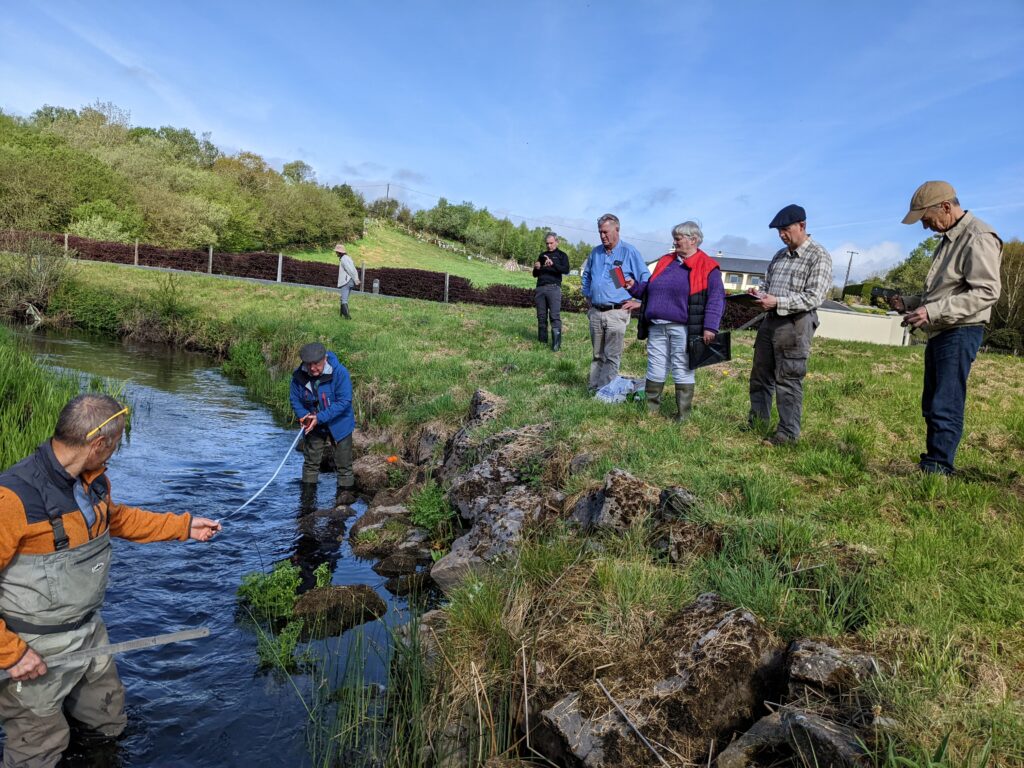
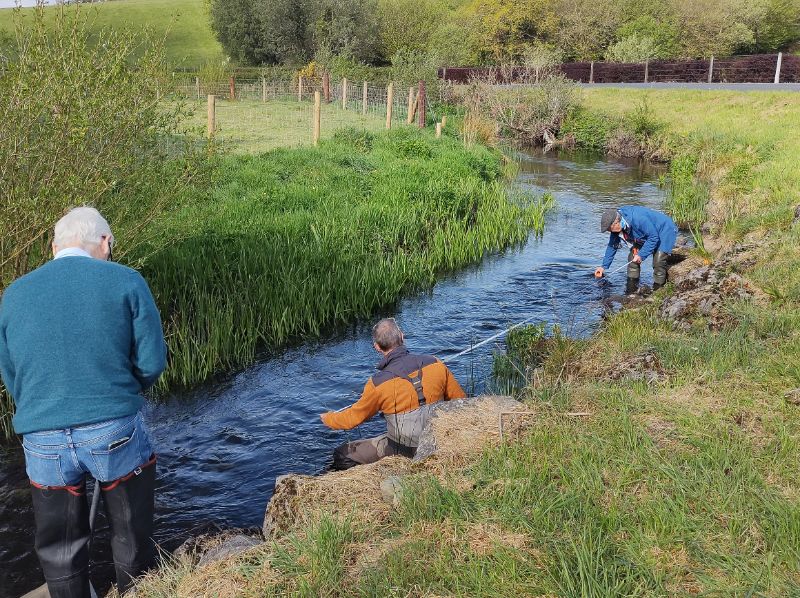
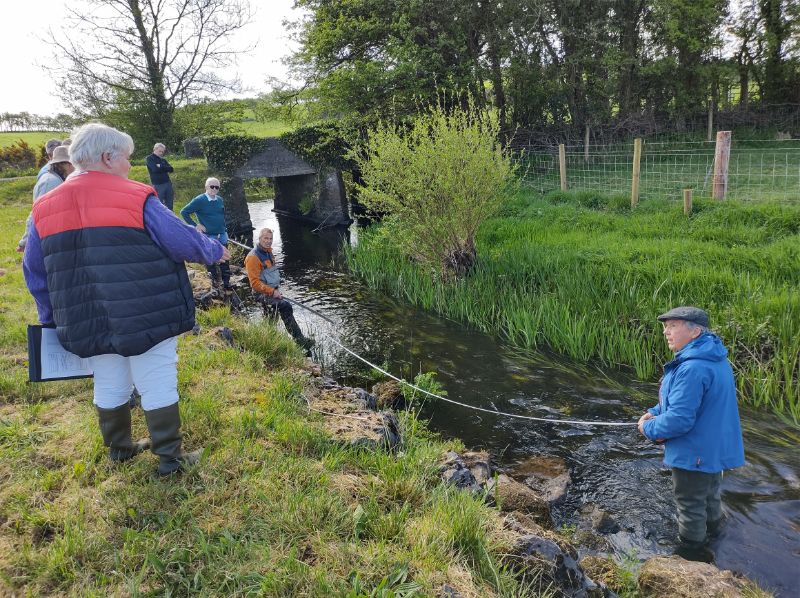
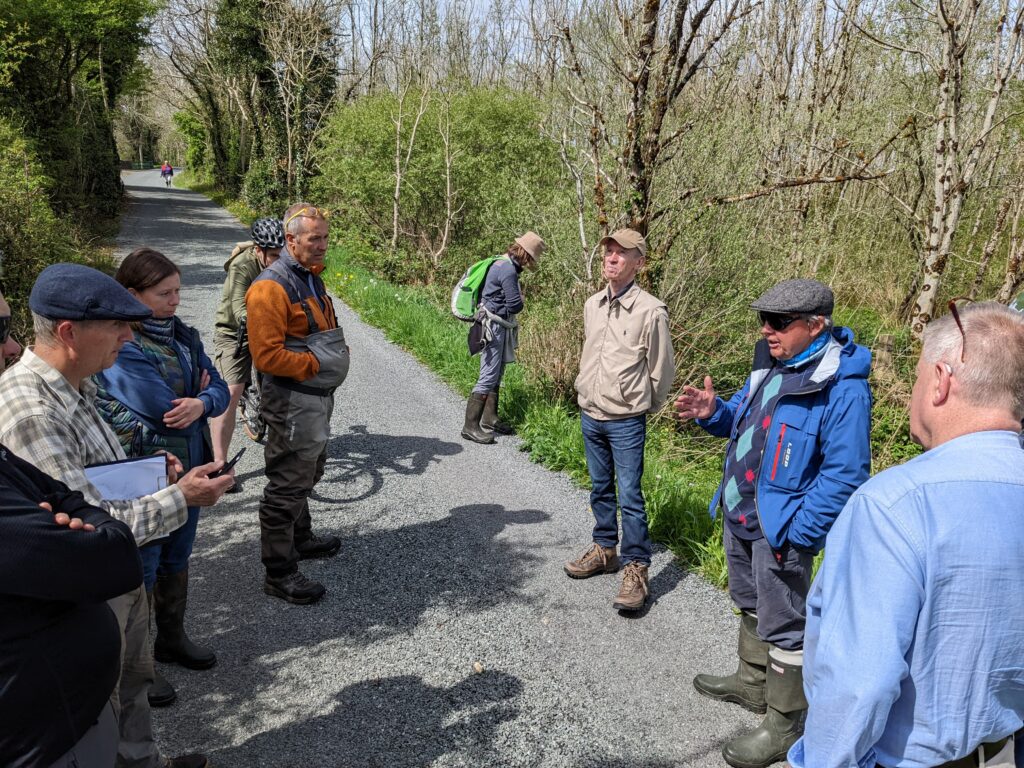
On Saturday 7 May 2022 we revisited the Carrowbeg River but this time concentrating on physical aspects such as flooding and potential natural water retention measures. We measured the flow rate of the river in terms of litres per second downstream of Knappabeg Lough – using measuring tape for the width, meter stick for the depth and an orange and stopwatch for its flow velocity. Check out the Carrowniskey trip for a more detailed explanation of how to measure flow.
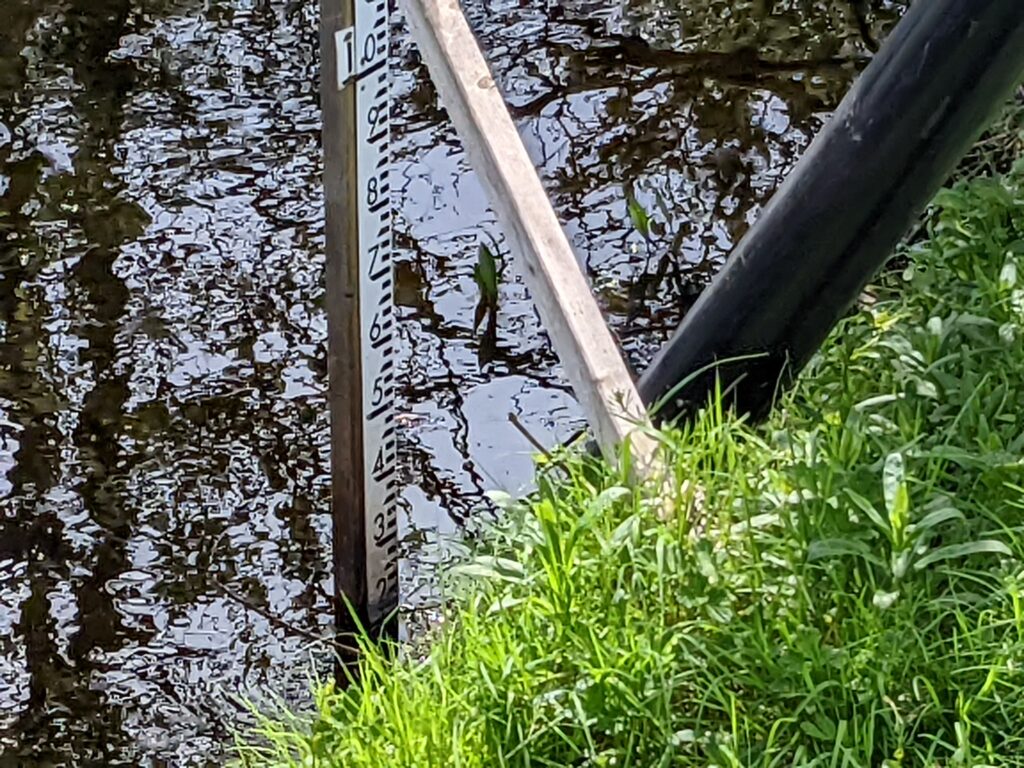
We compared this with the official flow gauge at Cooloughra Bridge. The staff gauge at the bridge is 1.97 meters in height and this is the exact height recorded on 15 December 2015 when Westport town suffered quite a severe flood. The rainfall-flow relationship is very strong with the river peaking approximately one day after a heavy rainfall event. It should be possible to create a flood alert system that would give about a day’s notice of impending floods by keeping track of rainfall in the upper catchment. Installing a simple weather station and linking it to a website could form the basis of a flood warning system, once the relationship between rainfall and flow is established, particularly how much rain is needed to cause the Carrowbeg to flood.
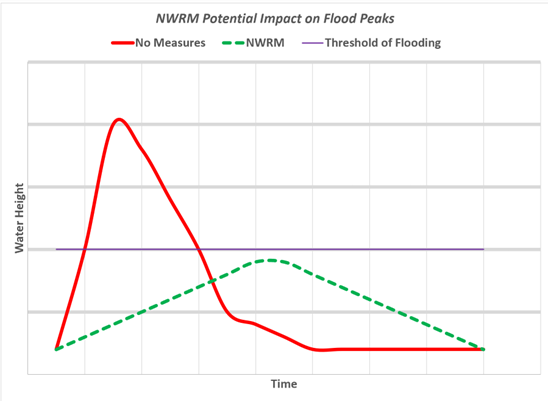
Potential for “flattening the curve” of Natural Water Retention Measures (NWRM)
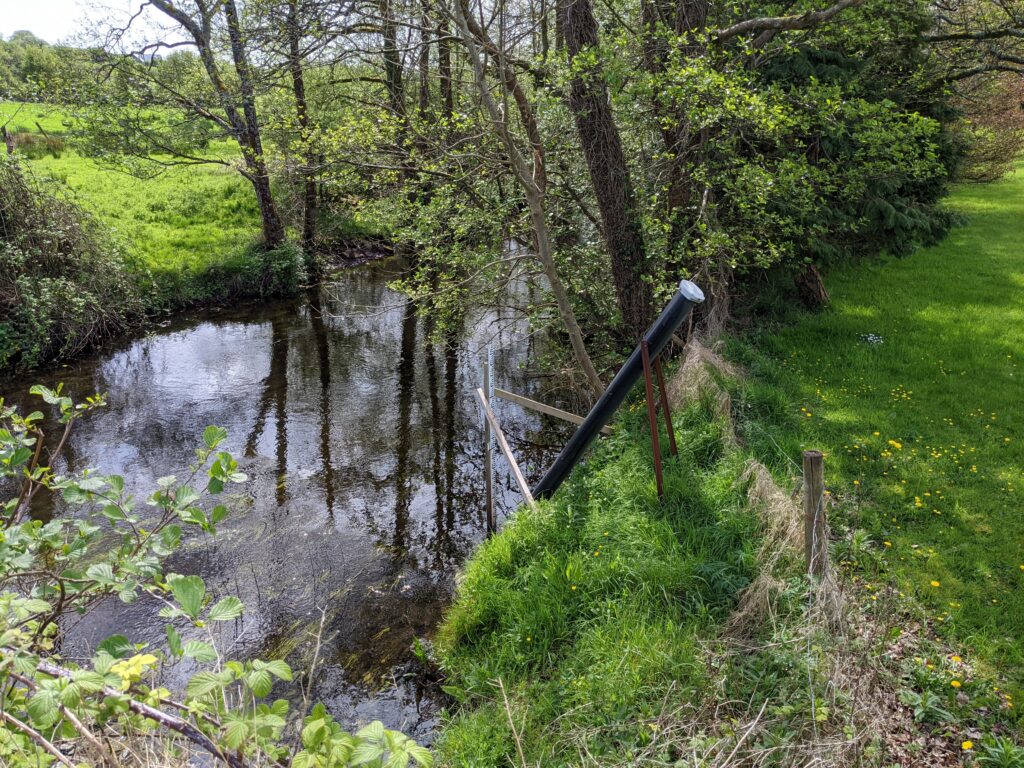
We looked at the wetland area immediately downstream of Knappabeg Lough and the adjacent smaller Cornacarta Lough at Garrow. Wetlands such as these help to soak up water following heavy rainfall and by the same token release water slowly in drought periods. A working group on Natural Water Retention Measures have published a set of documents exploring methods for reducing floods by storing or slowing water in the catchment by natural methods.
In addition Jackie Hunt provided us with tools to examine the riparian and catchment landscape showing us how to map the landscape and contrast the biodiversity of managed grassland versus native woodland and riparian trees.
In the afternoon we met at the Town Hall Theatre in Westport and explored the various data sources available on the web. We talked about flow and rainfall data, flood maps and a wide range of data sets relevant to water. Links to the many sources of water-related data are available on the “Useful Data Sources” page on this website.